How to guide: Getting started
Welcome to CODI! This article explains how to navigate into CODI
CODI home page
The CODI home page will by default open into the All dataset (public and private) which is represented by a globe on the quick access toolbar on the left side.
Uploading a dataset
This will open the upload page.
example.locb
example_map.nim
example_acq.nim
optionally any other files with the same prefix e.g. example.txt
At this point a few options are available (note that any options on the left hand side can be adjusted after uploading too):
Adjust the dataset title for CODI
Add a description
Add tags to the dataset
Choose to make the dataset public on upload (datasets default to private)
View a list of files ready to upload
Remove all files from the upload list
Add more files to be uploaded to this dataset
Once these options are set, click the ‘Upload all’ button to upload and create a dataset.
Upload progress is displayed in percentages for each file.
Once uploaded the dataset will need to be optimised for the cloud, this process can take a minute or two. After this, the dataset will be ready to view and analyse by clicking on the purple arrow button.
Note that if the purple arrow is clicked before optimisation is complete, then the dataset information page may show a warning complaining about a missing .pointCloud file. This is a known issue and the warning can be safely ignored as an optimisation is already running.
Opening a dataset
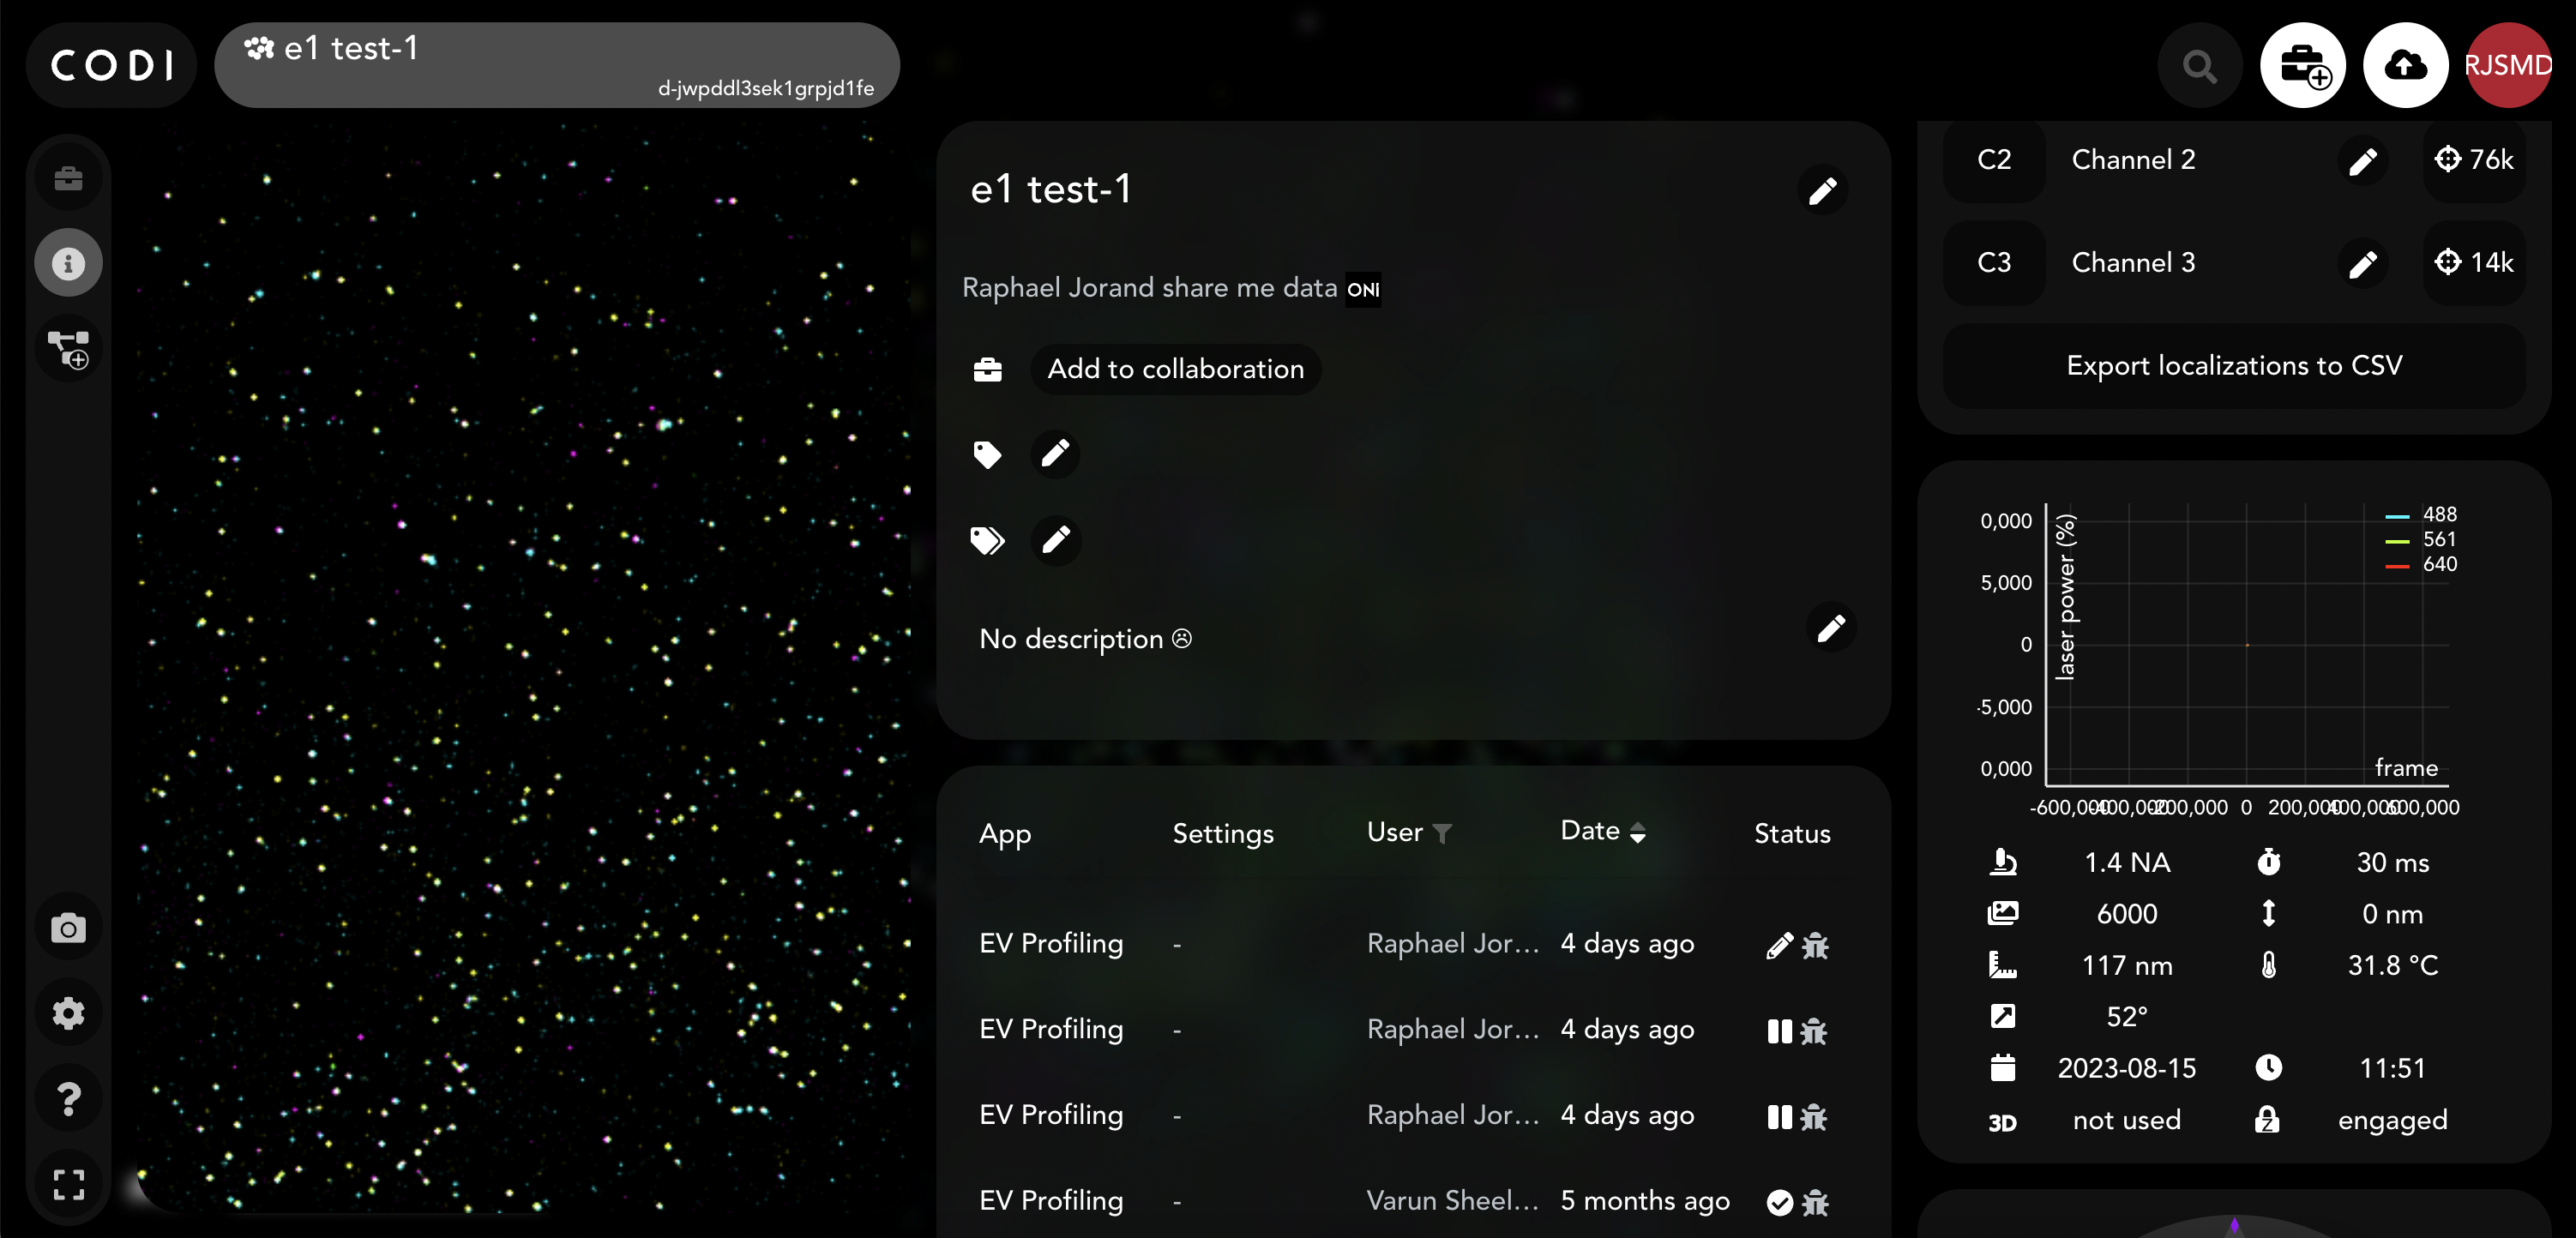
When clicking through to a newly uploaded dataset, or opening a dataset from the home page, CODI will navigate to the dataset’s information page.
On this page there are 9 boxes separated into multiple columns. It is usually necessary to scroll each columns to see all the boxes. From the first on the top left, those are:
The saved views of the dataset
All the uploaded files
Dataset details including title, tags and description (editable for dataset owners
Executions run on the dataset
Comments
The ownership of the data
Channel names (editable for dataset owners)
Acquisition metadata
The rating star for the dataset
For more information on all those boxes, please read our Dataset homepage article.
Visualising a dataset
To visualise a dataset click on a dataset view to be taken to that snapshot in the viewer, or click on the Analysis icon in the left side menu to get into the analysis options.
This is the CODI viewer! Users can explore datasets using navigation similar to viewing maps online, for example:
pinch/scroll to zoom in and out
click and drag to pan
right click and drag to rotate
Related Articles
How to guide: CODI Apps and Batch Analysis
Welcome to CODI Apps and Batch Analysis CODI Apps and Batch Analysis is an enhanced version of the CODI platform that unlocks faster and more customized analysis pipelines. Each App contains a set of powerful analysis widgets that enable scientists ...Release Note: CODI Apps and Batch Analysis - June 2023 Release [Updated August 2023]
Welcome to the latest release notes for CODI Apps and Batch Analysis! For questions about the new software release, please contact our Customer Success team on https://help.codi.bio/ or any software team member directly via ONI-Club slack channel. ...How to guide: Clustering tool
Tool view Purpose of tool The tool performs clustering on localisation data to find biological structures and quantify their statistical and morphological properties. The default clustering method is HDBSCAN. The cluster results can then be ...How to guide: Visualization panel
For the moment CODI is only able to display super-resolution microscopy data, meaning images create from localizations of blinking event. For the visualisation or analysis of raw images, such as brightfield, widefield or tracking, please us NimOS or ...How-to-guide: How to share and organize your data
Tool View Purpose of tool CODI is a Collaborative Discovery platform to share your data and analyses with colleagues and the public, opening up new possibilities for cross dataset insights. Using our tool Collaborations you will be able to organize, ...